


As fear overtakes the cryptocurrency market, the Bitcoin price has seen a sharp rise in selling pressure. On the daily chart, the price action creates a falling wedge formation as it approaches the $40,000 level, with an 18% drop from the resistance trendline in the last two weeks. Furthermore, a bearish continuation is more likely with the death cross. Will the bulls be able to resist the selling pressure, or will the price fall below $35,000?

Bitcoin (BTC)– The rise in selling pressure, on the other hand, causes the price to fall below the $46,000 threshold and into the $40,000 range. On the daily chart, the price struggles to hold near the $40,000 support zone and develops a falling wedge formation. If the bulls can resist the selling pressure, the price will reverse.
The death cross of the 50 and 100 days EMA on the daily chart is the outcome of the 18% price drop in the last two weeks. As a result, the price implies an increase in underlying bearishness and points at a downfall.
The daily Relative Strength Index reveals that it is oversold and that the bearish trend is reaching saturation. As a result, a modest retracement before the fallout is likely feasible. Following the fallout from the $46,000 support level, the price of BTC falls 10% to the $40,000 mark. Meanwhile, the price level is consolidating between the support zone, the breakout of which will determine the following trend.
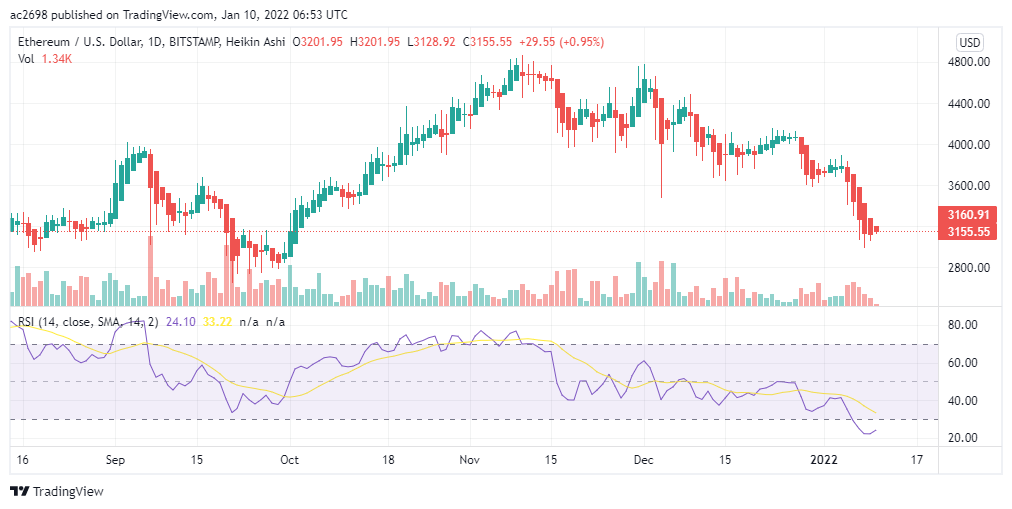
Ethereum (ETH)– lost its strong support levels during the recent bloodbath, including the 200-EMA, the $3,600 sentimental threshold, and price pattern support. Today, the price of Ethereum fell sharply, breaching the 0.5 Fibonacci retracement line, hinting that the corrective phase is prolonging.
The bearish candle surpassed both the support trendline and the $3,600 horizontal barrier on January 5th, providing a short opportunity for crypto traders. However, the crypto market slaughter exacerbated selling pressure, lowering the coin price to $3,000. The technical chart indicates a 20% drop in one week.
The important DMA levels (20, 50, 100, and 200) imply a negative trend for the ETH price. Moreover, the 50 and 200 DMA death crossing might entice more selling into the market. The price of Ethereum is presently trading at $3,168, up 2.81% on the day. The bearish movement has now surpassed another support level of 0.5 Fibonacci retracements, giving market sellers a more advantage.
Join us for more updates: Facebook | Telegram | Linkedin | Twitter
MX Global– Built in Malaysia for Malaysians
Legal Risk Disclosure:
Trading on cryptocurrency carries a high level of risk, and may not be suitable for all investors.
The high degree of leverage can work against you as well as for you. Before deciding to trade with MX Global, you should carefully consider your investment objectives, level of experience, and risk appetite.
The possibility exists that you could sustain a loss of some or all of your initial investment and therefore you should not invest money that you cannot afford to lose.
You should be aware of all the risks associated with cryptocurrency trading, and seek advice from an independent financial advisor.
DISCLAIMER:
Any opinions, news, research, analyses, prices, or other information discussed in this presentation or linked to from this presentation are provided as general market commentary and do not constitute investment advice.
MX Global Team does not accept liability for any loss or damage, including without limitation to, any loss of profit, which may arise directly or indirectly from the use of or reliance on such information.


