


Bitcoin kept most of the weekend hovering slightly around $43,000, where it started. Investors were looking for hints that bitcoin’s downward trajectory had ended and that the largest cryptocurrency by market capitalization was about to initiate a major bull cycle. Ether, the second-largest cryptocurrency, followed a similar lackluster trend. When Bitcoin falls abruptly, investors and traders look for positive buy to confirm a bottom and reversal; unfortunately, we haven’t spotted much of that since Bitcoin recently fell below $40,000.
The crypto industry is struggling as the COVID-19 virus’s Omicron variant rages and many companies struggle with supply chain challenges and rising raw material costs. The Federal Reserve of the United States also stated on Wednesday that inflation had reached 7%, a 40-year high.
Related article | Explained: How can I keep my cryptocurrencies safe?
Bitcoin (BTC)- When the price sank to the $40,000 support, it had been devalued roughly 40%. A falling channel pattern is influencing the price, resulting in this corrective rally. In addition, the technical chart shows that the 50 and 200 DMAs are about to make a death crossover, implying that market participants are gloomy.
The price resonates in a falling channel pattern on the daily time frame chart, as in our earlier discussion of Bitcoin price research. This pattern began in November 2021 and the corrective phase is currently ongoing.
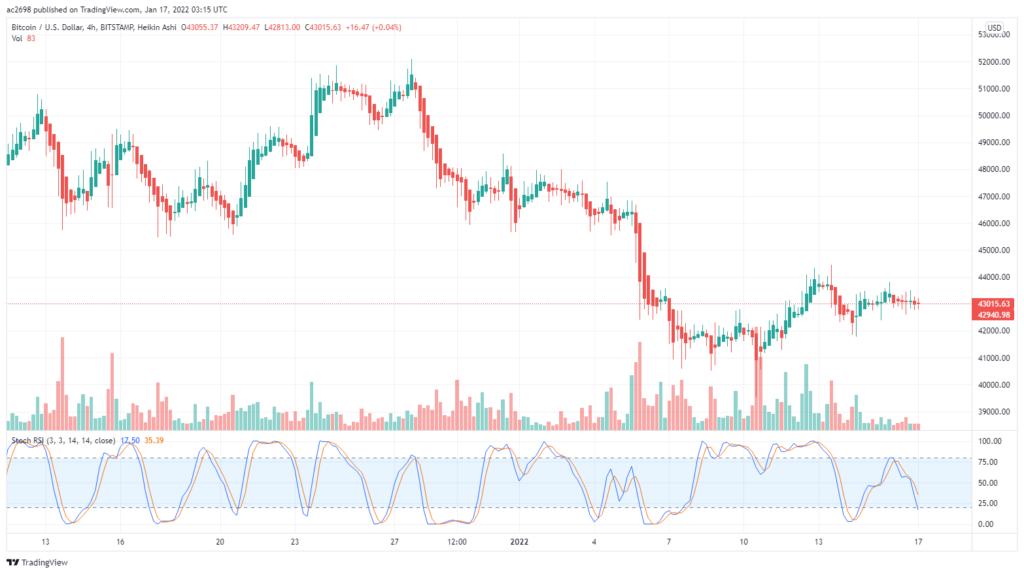
This downward rally set a new lower low of $40,000, a psychological threshold. From this level, the price found strong support, signifying price reversal. The Daily-Stochastic RSI, on the other hand, displays a bullish crossover of the K and D lines and is constantly climbing towards the higher level.
BTC is presently trading at $43,367, marking a 9.17 % rebound from the lowest support. On the 4-hour time frame chart, this modest bullish reversal has formed a cup and handle pattern. The resistance zone (neckline) for this pattern is approximately $45,000, giving crypto traders an appealing long position.
Furthermore, in order to complete this bullish pattern, the coin price would breach the falling channel’s resistance trendline, igniting a comeback rally. The average directional movement index has indicated that the price is losing its negative momentum.

Ethereum (ETH)- The price has hit a new lower low of $3,300 during the corrective rebound. When the price reached this level of support, it had been reduced by around 38%, showing that it was under high pressure. The market movement and indications have begun to turn bullish, hinting that a new rally is on the horizon.
When we last discussed Ethereum, the pair suffered a bearish collapse from the 50% retracement support level of $3,300. The price retested the lower time frame chart and, as predicted, dropped to $2900. The price gained good support at this bottom level, which is also the 0.618 Fibonacci retracement level. On January 11th, the chart showed a couple of lower price rejection candles at this support before leaping off with a bullish engulfing candle.
In comparison to the market activity, the daily Relative Strength Index suggests a strong rebound. Furthermore, the RSI slope has recaptured the 20-SMA line. The price of ETH has recovered from the $2,900 support level. The currency is presently trading at $3,364, marking a 12.74% increase from the lowest support. In the 4-hour time frame chart, this slight recovery shows the formation of a rounding bottom pattern.
Given this formation, the coin price should surge to the overhead resistance neckline of $3,900 in the anticipation of sparking off a new rally. For the time being, the price has pushed through a modest resistance level of $3,300, allowing long traders to enter the market. The MACD and signal lines are on the verge of crossing above the neutral line, implying rising bullish momentum.
Join us for more updates: Facebook | Telegram | Linkedin | Twitter
MX Global– Built in Malaysia for Malaysians
Legal Risk Disclosure:
Trading on cryptocurrency carries a high level of risk, and may not be suitable for all investors.
The high degree of leverage can work against you as well as for you. Before deciding to trade with MX Global, you should carefully consider your investment objectives, level of experience, and risk appetite.
The possibility exists that you could sustain a loss of some or all of your initial investment and therefore you should not invest money that you cannot afford to lose.
You should be aware of all the risks associated with cryptocurrency trading, and seek advice from an independent financial advisor.
DISCLAIMER:
Any opinions, news, research, analyses, prices, or other information discussed in this presentation or linked to from this presentation are provided as general market commentary and do not constitute investment advice.
MX Global Team does not accept liability for any loss or damage, including without limitation to, any loss of profit, which may arise directly or indirectly from the use of or reliance on such information.


