


On Friday, the crypto market was a sea of red, with bitcoin, the world’s largest cryptocurrency by market capitalization, falling more than 10% in the previous 24 hours.
Global investors appear to have begun the year with a lower appetite for risk, resulting in greater correlations between speculative assets such as cryptocurrencies and stocks, resulting in widespread losses. Bitcoin has dropped over 40% from its all-time high of around $69,000.
Due to their higher risk profile in comparison to bitcoin, other cryptocurrencies led the way lower on Friday. In the last 24 hours, Ether, the world’s second-largest cryptocurrency by market capitalization, has lost roughly 13% of its value.
Numerous market participants who acquired Bitcoin around its all-time high have taken to social media to express their worries. El Salvador’s President, Nayib Bukele, is unconcerned with the recent drop, as he just announced the purchase of 410 Bitcoin at an average price of $36,585. After the recent carnage, will Bitcoin and Ethereum see a rebound? Let’s have a look at the cryptocurrencies that might outperform if a recovery rally commences.
Related article | Explained:What is the purpose of mining pools and how do they work?
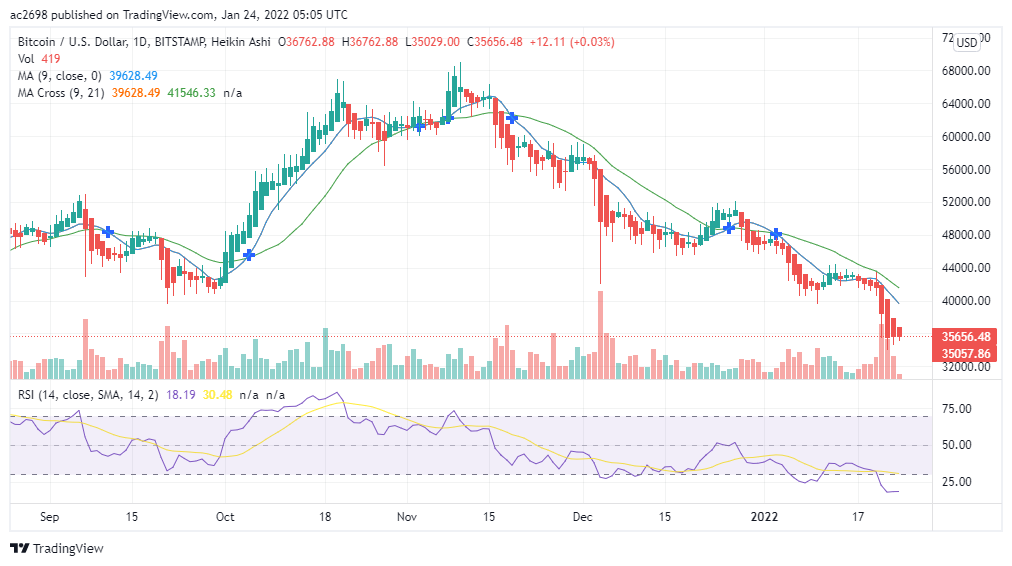
Bitcoin (BTC)– On January 21, the price cut below the lower threshold of the downward parallel channel, placing a 16 % drop near $29,026 on the watchlist.
The Bitcoin price’s first line of defense is around its July 25 low of $33,851. Further strongholds for the benchmark cryptocurrency may appear at $31,973 and $30,151, the June 27 and June 26 lows, respectively. Assuming Bitcoin falls below the indicated levels of support, it may eventually approach the bearish target provided by the prevailing technical pattern at $29,026, which corresponds to the 127.2 % Fibonacci retracement level.
Traders should keep in mind that if Bitcoin falls below the aforementioned bearish threshold, it may fall much farther, to levels not seen since January 2021. Nevertheless, if buying pressure intensifies, Bitcoin’s price will run into instant resistance at $35,570, which is the lower limit of the current chart pattern. The 78.6 % Fibonacci retracement level, which aligns with the midway boundary of the falling parallel channel, might be another stumbling block.
A burst in buy orders might push Bitcoin to the top edge of the ongoing chart pattern next at $40,878, where the 61.8 % Fibonacci retracement and the 21 twelve-hour Simple Moving Average (SMA) overlap. Greater objectives will be to break above the topside trend line of the descending parallel channel pattern, but many barriers may surface, first at the 50% retracement level at $43,016, which coincides with the 50 twelve-hour SMA, and then at the 38.2 % Fibonacci retracement level at $45,154.
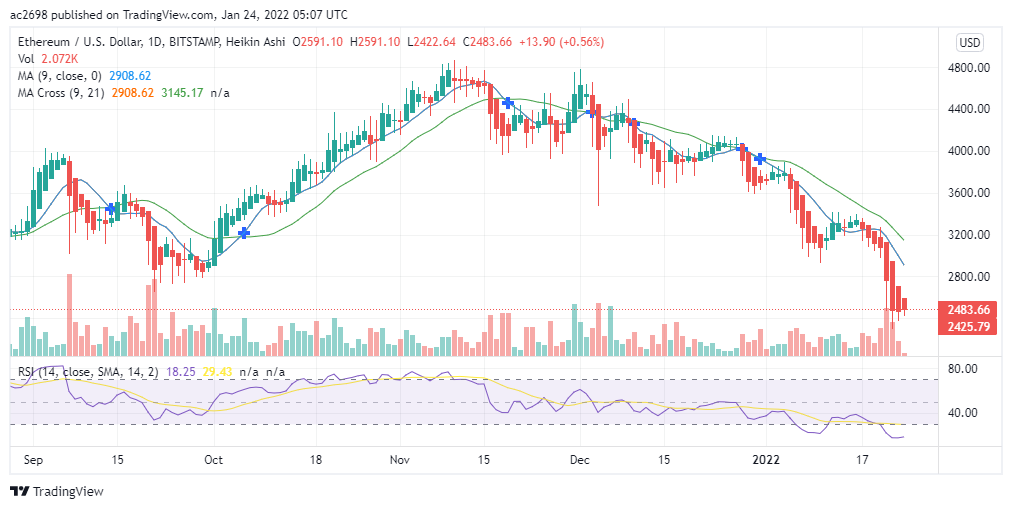
Ethereum (ETH)- At $2,353, the price of Ethereum has surpassed the bearish objective set by the current chart pattern. ETH has marginally recovered, but it is having problems finding a stable line of support to avoid further collapse. On the 12-hour chart, Ethereum price has cut below the lower border of the falling parallel channel, achieving the downbeat momentum by the underlying chart pattern at $2,353.
Whereas the Ethereum price has struggled to reverse the period of underperformance, ETH may keep falling within the lower parallel channel if the bulls are unable to drive prices higher. If a catastrophic sell-off happens, Ethereum price might drop to the bearish trend line of the lower parallel channel at $2,297 before descending to the 127.2 % Fibonacci extension mark at $2,004.
If buyers come into the market, Ethereum price may find immediate resistance at the 78.6 % Fibonacci retracement level at $2,544, followed by the 61.8 % Fibonacci retracement level at $2,730, which coincides with the lower threshold of the existing chart pattern. With a surge in purchasing pressure, ETH might break the % retracement level at $2,861 before marking the 38.2 % Fibonacci retracement level at $2,992, where the 21 twelve-hour Simple Moving Average (SMA) is also positioned.
Before Ethereum’s price reaches the 23.6% Fibonacci retracement level at $3,154, which is at the upper boundary of the prevailing technical pattern, it may need to gain further momentum. The Momentum Reversal Indicator (MRIresistance )’s line indicates that Ethereum may encounter a real challenge at the topside trend line of the current chart pattern. Only a clear break above the stumbling block might indicate the end of the slump.
Join us for more updates: Facebook | Telegram | Linkedin | Twitter
MX Global– Built in Malaysia for Malaysians
Legal Risk Disclosure:
Trading on cryptocurrency carries a high level of risk, and may not be suitable for all investors.
The high degree of leverage can work against you as well as for you. Before deciding to trade with MX Global, you should carefully consider your investment objectives, level of experience, and risk appetite.
The possibility exists that you could sustain a loss of some or all of your initial investment and therefore you should not invest money that you cannot afford to lose.
You should be aware of all the risks associated with cryptocurrency trading, and seek advice from an independent financial advisor.
DISCLAIMER:
Any opinions, news, research, analyses, prices, or other information discussed in this presentation or linked to from this presentation are provided as general market commentary and do not constitute investment advice.
MX Global Team does not accept liability for any loss or damage, including without limitation to, any loss of profit, which may arise directly or indirectly from the use of or reliance on such information.


