


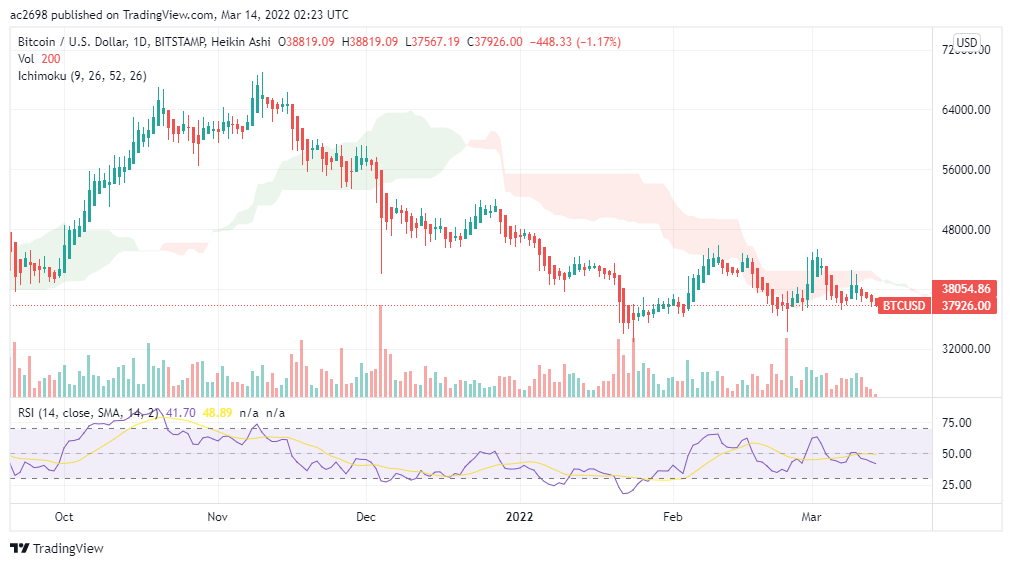
The formation of a Doji candle by the Bitcoin price indicates market hesitation. The coin price has been pushed to the bottom support trendline of $38,283 by the recent bear cycle, with the hope of resuming bullish momentum. The buyers’ inability to break through the immediate barrier of $45,000, on the other hand, threatens the rising triangle’s collapse.
Source from Tradingview
Bitcoin(BTC)- the price has been oscillating between a strong resistance of $45,000 and an upward trendline for the previous two months. An ascending triangle has formed during this range-bound advance, indicating that the price will ultimately break through this tough barrier.
On March 8th, the buyer’s price sought to rebound from the dynamic trendline, and on March 9th, the price produced a tremendous bullish breakthrough from the $40,000 barrier. Nevertheless, the bull cycle was unable to maintain its position above the broken resistance, and the price fell below it the next day.
In the previous two days, the Bitcoin price has moved inside a fairly narrow range that stretches from $40,000 to a rising trendline. As a result, traders can take this range as a no-trade zone and wait for a true breakout before establishing a new position.
The bullish recovery would take the cryptocurrency by 13% to target the $45,000 resistance if buyers could break through and close above the shared resistance of $40,000 and the 20-day EMA.
A bearish collapse from the support trendline, on the other hand, would suggest the continuation of the decline and send the cryptocurrency down 15% to retest the January low of $33,000.
The relatively flat pivotal EMAs (20, 50, 100, and 200) in a bearish sequence signal that the route to least resistance is lower. As BTC price movement amplifies a range-bound rise, the Relative Strength index slope follows a similar pattern.
For over two months, the second-largest cryptocurrency has been locked in a symmetrical triangular pattern. The price of Ethereum (ETH) is slowly approaching the pattern’s support trendline. Will buyers be able to recover from this volatile support, or will sellers finally breakthrough?
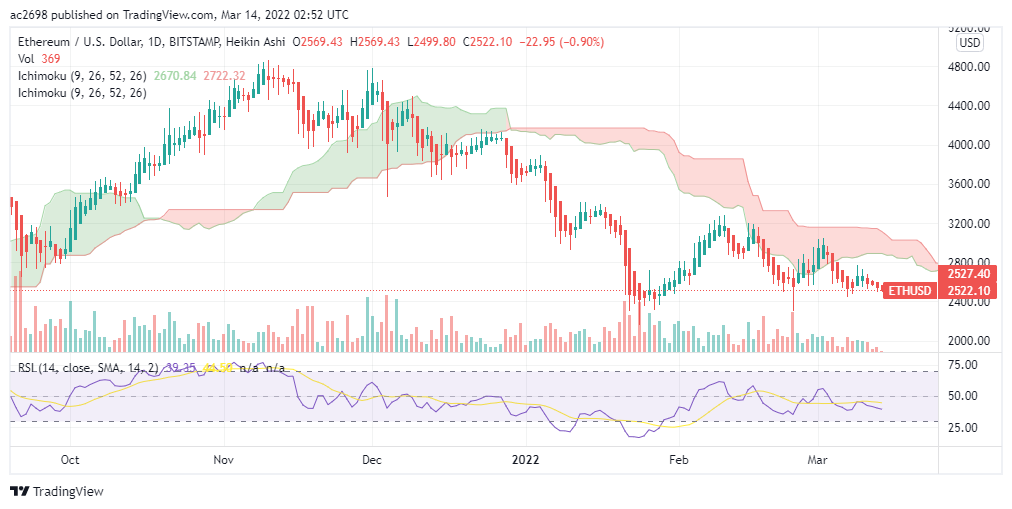
Ethereum (ETH)- The selling trendline of the continuation pattern is gradually being approached. If the price is able to recover from increasing support. For a few more days, traders may expect the market to remain range-bound.
Therefore, if sellers were able to push cryptocurrency below the dynamic support, the coin’s price would plummet to the lowest support level of $2,300, which was reached in January.
The area between the converging trendlines, on the other hand, is a no-trade zone, and traders should wait for the price to breach either of them to signify a significant directional shift. ETH is now trading at $2,566, signifying a 0.04 % intraday loss.
The downward sloping EMAs (20, 50, 100, and 200) indicate that the sellers have the advantage. In addition, the 20 and 50-day EMAs provide dynamic resistance to cryptocurrency. A range-bound rally is highlighted by the daily-Relative Strength Index signal oscillating around the equilibrium.
Are you ready to dive into crypto?
Join us for more updates: Facebook | Telegram | Linkedin | Twitter
MX Global– Built in Malaysia for Malaysians
Legal Risk Disclosure:
Trading on cryptocurrency carries a high level of risk, and may not be suitable for all investors.
The high degree of leverage can work against you as well as for you. Before deciding to trade with MX Global, you should carefully consider your investment objectives, level of experience, and risk appetite.
The possibility exists that you could sustain a loss of some or all of your initial investment and therefore you should not invest money that you cannot afford to lose.
You should be aware of all the risks associated with cryptocurrency trading, and seek advice from an independent financial advisor.
DISCLAIMER:
Any opinions, news, research, analyses, prices, or other information discussed in this presentation or linked to from this presentation are provided as general market commentary and do not constitute investment advice.
MX Global Team does not accept liability for any loss or damage, including without limitation to, any loss of profit, which may arise directly or indirectly from the use of or reliance on such information.


