


")
The aggressive investors who bought the breakout trade may have been trapped by the recent tumble from the $45,000 barrier. Bitcoin (BTC) is now trading at $42,645, with a weekly candle closing below $45,000. The chart, on the other hand, shows a rising wedge structure, which could avoid any severe loss during this reversal.
Related article | What Is Cryptojacking, And How Can I Protect Myself From It?
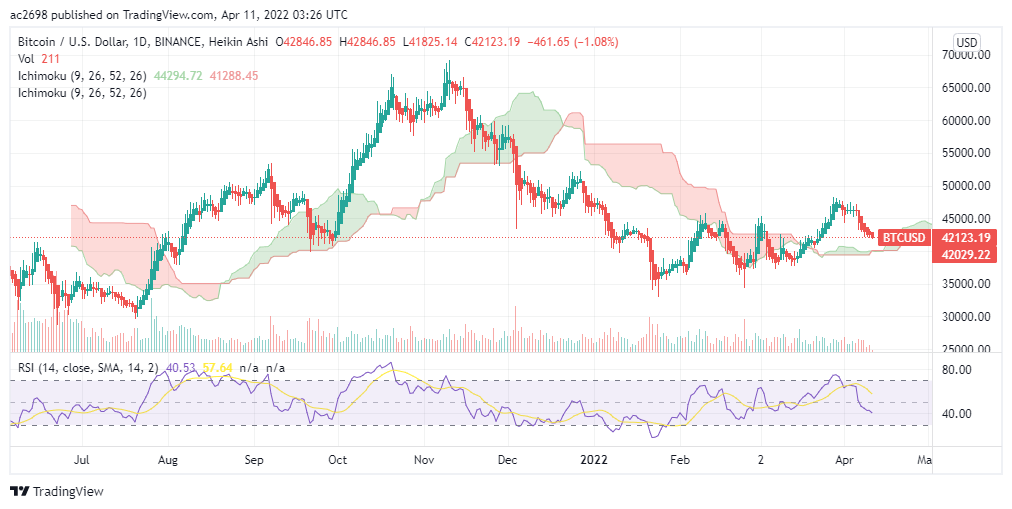
Bitcoin(BTC)– price broke past the $45,000 resistance after spending the previous quarter in a buildup phase. The coin price posted a weekly candle-closing above this barrier on March 24th, indicating that buyers want to push higher.
Meanwhile, the bulls were unable to maintain their escape, causing sellers to pull the price down below the broken level. In conclusion, traders who entered over $45,000 may dump their positions, furthering the bearish trend.
The BTC traders are moving to a rising wedge structure on the technical chart, and the latest retracement phase is only a return to the support trendline. Besides, the $40,000 support, which is linked with the ascending trendline, will provide solid support for more bullish moves.
BTC’s 100 and 200-day EMAs are flat, indicating a sideways direction. However, the fact that the coin price is trading below these key EAMs shows that sellers have a better position.
The slope of the Relative Strength Index(45) fell below the neutral line, showing that traders were feeling gloomy.
A minor retracement in the Ethereum was sparked by the shared resistance of $3,580 and the 200 DMA. The sellers made a solid fall from the $3,300 support on April 6th, implying a price drop to $3,000. Long traders may benefit from a bullish crossover between the 50 and 100 DMAs near $3,000 support.
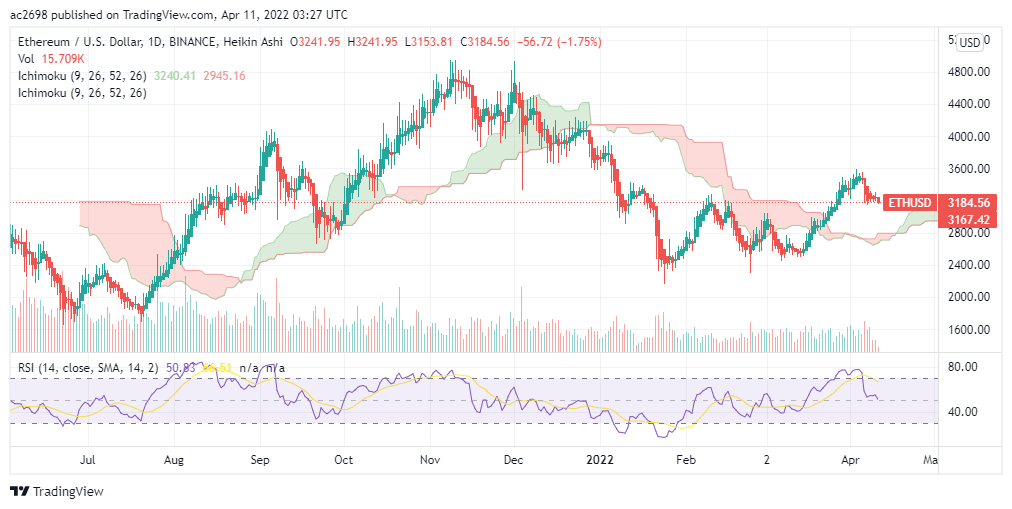
Ethereum(ETH)-The ETH price has outperformed Bitcoin during the latest rebound surge, rising % in the previous three weeks. The bullish rise topped out at $3,457, its highest point since early January.
Instead, sellers gained control of the recent market volatility and drove the coin underneath the $3,300 support level. In a natural outcome, the ETH price has fallen by 10% since last week and is on track to give a weekly close below the ruptured support.
A bullish crossing between the 50 and 100 DMA near the support zone at a level of $3,000 may reinforce an upside reversal, thus interested investors should keep an eye on it. A bearish crossing between the VI+ and VI- slopes would give more proof for a downturn. The directional index on average: The decreasing ADX(22) slope also suggests that buyers are losing control of the ETH price.
Are you ready to dive into crypto?
Join us for more updates: Facebook | Telegram | Linkedin | Twitter
MX Global– Built in Malaysia for Malaysians
Legal Risk Disclosure:
Trading on cryptocurrency carries a high level of risk, and may not be suitable for all investors.
The high degree of leverage can work against you as well as for you. Before deciding to trade with MX Global, you should carefully consider your investment objectives, level of experience, and risk appetite.
The possibility exists that you could sustain a loss of some or all of your initial investment and therefore you should not invest money that you cannot afford to lose.
You should be aware of all the risks associated with cryptocurrency trading, and seek advice from an independent financial advisor.
DISCLAIMER:
Any opinions, news, research, analyses, prices, or other information discussed in this presentation or linked to from this presentation are provided as general market commentary and do not constitute investment advice.
MX Global Team does not accept liability for any loss or damage, including without limitation to, any loss of profit, which may arise directly or indirectly from the use of or reliance on such information.


